Radar Toolbox
The Radar Toolbox is used to control the map grid that displays the various weather products.
Radar Info
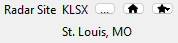
Radar Site
The Radar Site section shows the currently active radar site for the selected map, along with the site’s location. When no site is selected, the toolbox shows no site and the range ring is hidden; placefiles and other map layers can remain visible.
Pressing the Site Selection button to the right displays the Select Radar Site dialog.

Radar Sites can be sorted or filtered by various parameters, including Site ID, location, type, and distance from the current location. Clicking the far-right column to add or remove a star icon will toggle the site as a preset. Double-clicking a site or pressing OK will pan the map and load radar data for the new site.
To clear the active radar site, press None in the dialog, or click the currently selected site again on the map (Radar Sites layer enabled). The map stays at the current view; only radar products and the range ring are cleared.
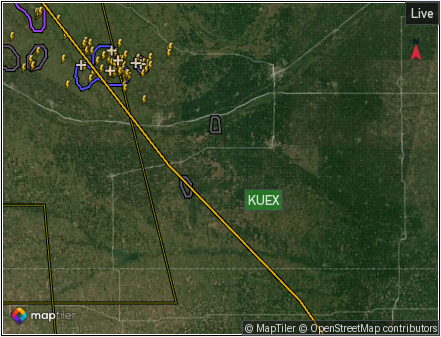
Map after deselecting a site (no range ring, no radar overlay; placefiles may still show).
Note
If the new site does not have the same radar products available as the previously selected site, an alternate radar product may need to be selected before updated data will display. This is especially the case when switching between WSR-88D and TDWR sites.
Pressing the Home button will change the active radar site to the default defined in settings.
If radar site presets have been configured, the Presets button will display. Pressing the Presets button will provide a dropdown menu with selected presets.
VCP
VCP is the Volume Coverage Pattern. The VCP defines how the radar scans the atmosphere, including what elevation tilts are scanned and the rotation speed of the radar. This section will also display the operating mode defined by the VCP: “Clear Air Mode” or “Precipitation Mode”.
For more information about VCPs, visit https://www.noaa.gov/jetstream/vcp_max.
Map Settings

Map Style
The Map Style dropdown will display a list of the available map styles for the selected map provider (Mapbox, MapTiler, or OpenFreeMap). Selecting a style will update the active map. None removes the vector underlay while keeping radar and other overlays. For details on the available map types, see the selected map provider’s website:
Mapbox: https://www.mapbox.com/gallery/
MapTiler: https://cloud.maptiler.com/maps/ (requires login)
OpenFreeMap: https://openfreemap.org/
Note
Not all map styles visible on the map provider’s website are available within Supercell Wx, as new map styles are added on a regular basis.
Shortcut: s or both mouse buttons
Smooth Radar Data
The Smooth Radar Data checkbox will enable radar data smoothing for the active map.
Track Location
The Track Location checkbox will query the operating system for the current location. The current location will appear as a crosshair icon on the map:

Radar Products
Level 2

Reflectivity

Level 2 Reflectivity (REF) is raw radar data that provides measurements of the intensity of reflected radar signals from precipitation targets, such as raindrops or snowflakes. This is commonly used to visualize the intensity of precipitation. Also note that this data is generally used for a more in-depth examination in comparison to Level 3 data.
Velocity

Level 2 Velocity (VEL) is raw radar data that provides measurements related to the motion of precipitation targets. It specifically focuses on the velocity or speed at which the precipitation targets are moving towards or away from the radar system. This is commonly used to identify areas of rotation, wind patterns, and the presence of severe weather phenomena like tornadoes or strong winds and derechos.
Spectrum Width

Level 2 Spectrum Width (SW) is raw radar data that represents the variation or dispersion in the Doppler velocities of precipitation targets within a radar beam. High values of spectrum width generally suggest the presence of turbulent atmospheric conditions, such as strong updrafts and downdrafts.
Differential Reflectivity

Level 2 Differential Reflectivity (ZDR) is raw radar data that measures the differences in the intensity of the returned radar signals between horizontal and vertical polarizations. It provides information about the shape and characteristics of the precipitation targets, such as raindrops, snowflakes, or hail. Positive values of ZDR indicate oblong or horizontally elongated targets, like raindrops or melting snowflakes, while negative values suggest spherical or vertically elongated targets, like hail or ice crystals.
Differential Phase

Level 2 Differential Phase (PHI) is raw radar data that measures the phase difference between the horizontally and vertically polarized radar signals. PHI helps in identifying phenomena like melting layers, supercooled liquid droplets, and distinguishing between different types of precipitation particles.
Correlation Coefficient

Level 2 Correlation Coefficient (RHO) is raw radar data that measures the similarity or correlation between the horizontally and vertically polarized radar signals. When RHO values are high, objects within the atmosphere have a stronger correlation, they are similar in size like raindrops. When the RHO values drop, different objects differ in size, and is likely indicative of debris. This helps in identifying if there’s debris from strong areas of rotation indicated from VEL data.
Clutter Filter Power Removed

Level 2 Clutter Filter Power Removed (CFP) is raw radar data that quantifies the amount of power or signal that has been removed by the clutter filtering algorithm. Clutter refers to unwanted radar echoes caused by non-meteorological objects such as buildings, trees, or ground features. The clutter filtering algorithm is designed to reduce the impact of these unwanted signals, allowing for a clearer representation of the meteorological targets, such as precipitation. A higher CFP value indicates a higher amount of clutter power successfully eliminated by the clutter filtering process.
Level 2 Elevation

The elevation buttons allow the user to specify a particular elevation angle of interest for data retrieval or display. Elevation angles are measured in degrees and represent the vertical tilt of the radar beam relative to the horizontal plane. Different elevation angles provide information about different layers of the atmosphere. Each Level 2 product in Supercell Wx will give you this ability.
For more information about elevation, visit https://www.noaa.gov/jetstream/vcp_max.
Level 2 Settings
When a Level 2 product with a color table is active, the Level 2 Settings section appears in the Radar Toolbox. Besides elevation selection, it includes an optional Threshold control for the color table.
Enable Enable Threshold to filter the display to values at or above the threshold. Adjust the value with the slider or type a number in the value field (units appear beside the field). Press Enter or leave the field to apply a typed value. The slider and text field stay in sync when you change units or range from the map; while you are editing the text field, live map updates do not overwrite your entry until you finish editing.
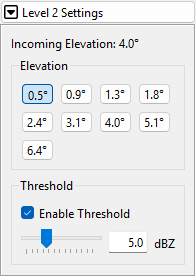
Level 2 Settings with Enable Threshold on, slider, and editable threshold value.
Level 3
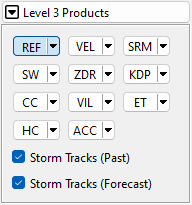
Reflectivity

Reflectivity Data Selection:

Level 3 Reflectivity (REF) is processed radar data that has been aggregated and averaged over larger spatial areas and time periods. This is commonly used to visualize the intensity of precipitation, and is used more-so for weather monitoring purposes. You can view Level 3 Reflectivity as Super-Resolution Data or as the standard Digital Reflectivity data.
Velocity

Velocity Data Selection:

Level 3 Velocity (VEL) is radar data that aggregates and averages the velocity measurements obtained from Level 2 radar data over larger areas and time periods to create a simplified representation of motion patterns. You can view Level 3 Velocity as Super-Resolution Data or as the standard Digital Velocity data.
Tilt Selection

Level 3 Settings
When a Level 3 product with a color table is active, the Level 3 Settings section appears in the Radar Toolbox. It provides the same Threshold controls as Level 2 Settings: slider, units label, and a text field for direct numeric entry.
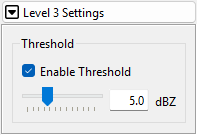
Level 3 Settings threshold row with typed value and units.
Timeline

Auto Update
The Auto Update status provides information about the status of your radar data, indicating whether you are currently receiving the most recent updates or if the feature has been disabled. Auto Update is active in two scenarios: when the animation is playing in Live View or when you access the latest scan using the end button (By default, you are always viewing the latest scan).
Enabled:
Disabled:

Live View
Live View enables you to observe real-time updates from the radar site you have selected, ensuring you stay up to date with the latest information.
Archive View
With Archive View, you have the ability to access historical radar data.
Animation Controls
Loop Time
Loop Speed
Loop Delay
 :
: Begin
 :
: Step Back
 :
: Play
 :
: Pause
: Step Back
 :
: Step Next
 :
: End